geog1011_m3_3
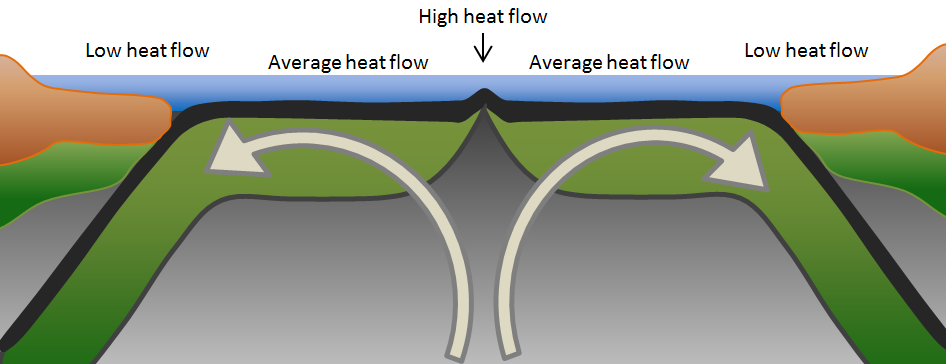
Figure 3-3. A depiction of the differences in heat flow through the oceanic crust, and the relationship to mantle convection and plate tectonics. © Steven Earle. Used with permission.
Figure 3-3. A depiction of the differences in heat flow through the oceanic crust, and the relationship to mantle convection and plate tectonics. © Steven Earle. Used with permission.