Table of Contents
5-2 Climate Change
Read Chapter 19 in Physical Geology.
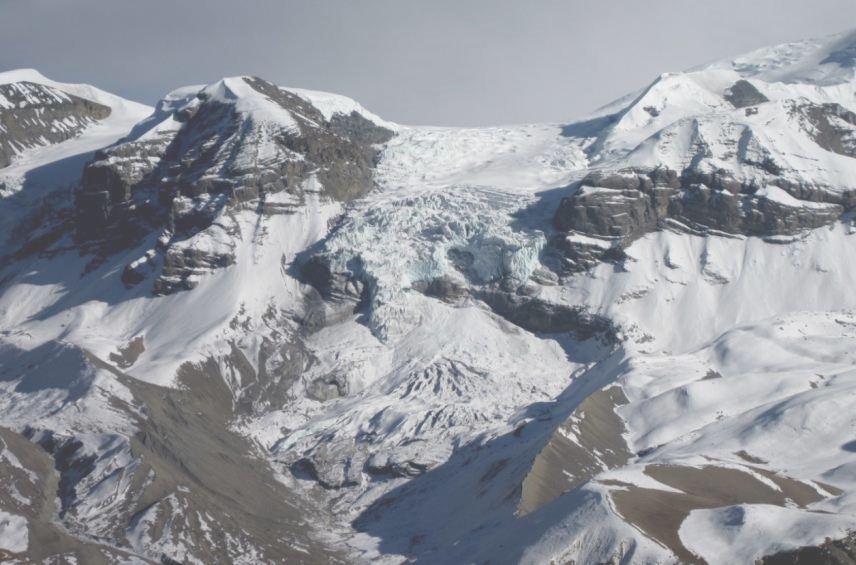
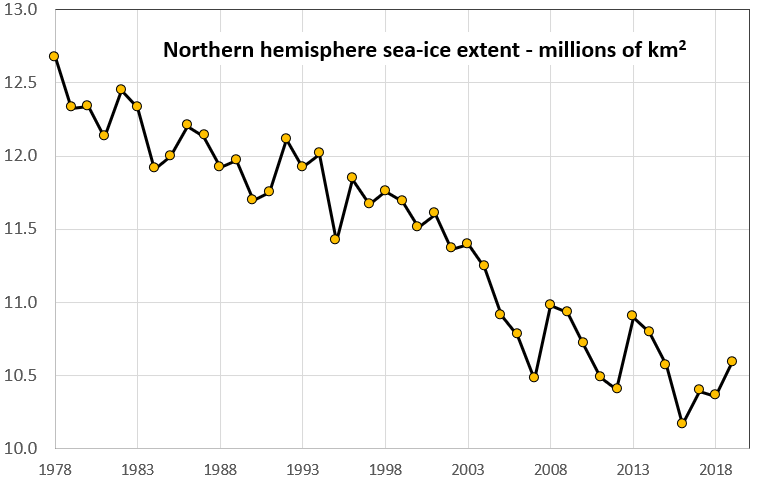
The mechanisms of climate change are summarized in Section 19.1. The wide range of natural climate forcing processes include subtle changes in the Earth’s tilt and orbit, variations in the output of the Sun, changes in the locations of continents and ocean currents, and changes in the composition of our atmosphere. However, before we look at these processes, it’s important to understand the many different climate feedback mechanisms. One that is relatively easy to understand is the effect of melting snow and ice. Snow- and ice-covered surfaces are bright compared to bare ground, forests, or open water (see Figure 19.1.9), so when snow or ice melts, these exposed surfaces become darker and thus absorb more solar radiation. This is a positive feedback loop because climate warming leads to the loss of snow and ice, and the loss of snow and ice contributes to more warming. Figure 5-5 is an example of change in snow and ice. Between 1978 and 2019, the areal extent of late-summer sea ice in the Arctic declined by around 2 million square kilometres. That means that there is now much more open water in the Arctic Ocean than there was just 4 decades ago, and this is part of the reason why there has been much greater warming of Arctic regions compared with more southerly regions. As described in the textbook, many different climate feedback mechanisms play a critical role in climate change.
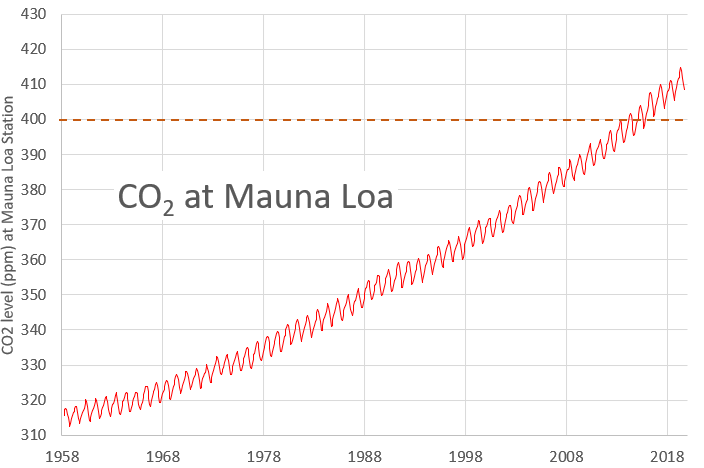
The main forcing mechanism in this present era of human-caused climate change has been an increase in the concentration of greenhouse gases (GHG) in the atmosphere. The nature of GHGs, and the mechanism by which they control climate, are explained in Section 19.1. In brief, GHGs are gases with three or more atoms (e.g., CO2 and CH4) that vibrate at frequencies that match the frequencies of the infrared radiation emitted by the surfaces of the Earth that have been warmed by the Sun. When this infrared radiation strikes a GHG molecule, the molecule vibrates more vigorously than it does normally, which heats the molecule and warms the atmosphere. The higher the concentration of GHGs in the atmosphere, the more infrared radiation energy is retained in the atmosphere. Global atmospheric CO2 levels are shown in Figure 5-6. In pre-industrial times, the CO2 level was around 280 ppm. In 2014, it exceeded 400 ppm for the first time in several million years. It is very unlikely to drop below that level during the lifetime of anyone reading this sentence.
Exercise: By referring to Figure 5-6, estimate the average CO2 level in the year you were born. By how many ppm had it increased by 2016?
Section 19.1 also discusses the climate effects of Milankovitch Cycles. Read that part because it is relevant to the cycles of the Pleistocene glaciations, which we covered in Unit 4.
Completing Exercise 19.1 will help you to understand some of the processes of natural climate change, and their implications for mass extinctions.
Figure 19.2.2 shows the record of global climate change from 1880 to 2018. We are now seeing a full degree (C) of global average temperature change since 1880, with no signs of any slowdown.
The various mechanisms of anthropogenic climate change are discussed in Section 19.2, and you should read through that carefully because it is in everybody’s interest to understand why and how we are changing the climate.
The mechanisms of anthropogenic climate change are well understood, and it’s not difficult to calculate how our activities will drive future change. Completing Exercise 19.3 will help you discover how we can make the link between the radiative forcing changes that our activities have caused and both past and future global temperatures.
While most of us understand that we are changing the climate, few of us fully appreciate the consequences of that change, now and—even more so—in the future. Some of these consequences are summarized in Section 19.3, including (but not limited to) the following:
- Sea-level rise, which may seem slow at present, will accelerate steeply over the next several decades (Figure 19.3.1).
- The increased intensity of tropical and other storms (Figures 19.3.2 and 19.3.3), when combined with sea-level rise, will displace or harm hundreds of millions of people.
- Greater precipitation amounts in most areas will cause increased flooding and slope failures (Figures 19.3.4 and 19.3.5).
- The ranges of pests and diseases will increase (Figure 19.3.7).
- Heat waves have increased the risk of heat-related casualties and of wild fires (Figure 19.3.9).
Exercise 19.4 provides you with an opportunity to understand the relationship between El Niño and precipitation in British Columbia. The data provided only goes as far as 2005, but as you might remember, the most intense El Niño on record occurred in 2015/2016. While you’re doing this exercise, think about the effects of that event on the weather at the time.
More important than just understanding climate change is the need for all of us to do our part to reduce our personal climate-changing behaviours. Complete Exercise 19.5 and take some time to think about what you might do to reduce your own impact on the climate.