Table of Contents
3-3 Earthquakes
Read Chapter 11 in Physical Geology.
As noted in Section 11.1, an “earthquake is the shaking caused by the rupture (breaking) and subsequent displacement of rocks (one part of the rock moving with respect to another) beneath Earth’s surface.” Before a body of rock breaks, it has to be strained (deformed—Figure 11.1.1), and in almost all cases, that strain is caused by the relative motion at plate boundaries. Where two plates are in contact with one another, the rocks on either side don’t typically slide smoothly past each other; instead, they stick along the boundary and then slowly deform elastically. Although the amount of deformation that the rock can withstand depends on its strength, all rock that is progressively strained will eventually be unable to handle the strain and will break.
Earthquakes do not occur at a single point within the crust, nor at a single moment in time. The displacement happens over an area called the rupture surface (Figure 11.1.2) and is greatest near to the middle of that surface and least towards the margins. The area of the rupture surface and the average amount of displacement determine the size (magnitude) of an earthquake. The displacement within a rupture surface occurs over a period of seconds (or even minutes if it’s a very large quake) and is characterized by a series of small earthquakes (immediate aftershocks), all of which are related to each other by the process known as stress transfer, which means that the reduction in stress in one area of the rupture surface actually adds to the stress elsewhere (see Figure 11.1.5). Understanding stress transfer and aftershocks is critical to understanding earthquakes, so read that part of Section 11.1 carefully, including the material on episodic tremor and slip.
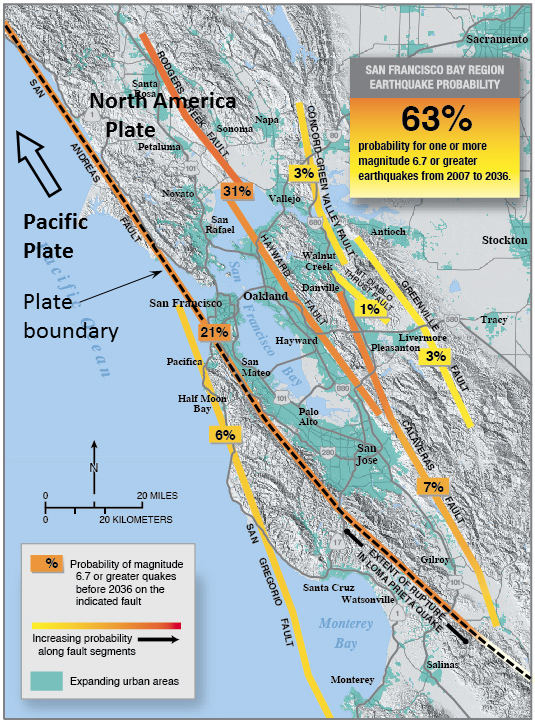
As described in Section 11.2, and shown in Figure 11.1.6, the relationship between plate boundaries and earthquakes is very strong. The vast majority of earthquakes occur within a few tens of kilometres of plate boundaries, and in some cases, right on the boundary plane or on a nearby structure (a fault) that is associated with the boundary. Figure 3-7 shows the known earthquake-producing faults in the area around San Francisco. The San Andreas Fault, which defines the boundary between the Pacific and North America Plates, has been responsible for many large quakes (including the devastating 1906 San Francisco earthquake and the damaging 1989 Loma Prieta earthquake), but other faults in the region also have caused significant quakes, and the greatest risk over the next 20 years is predicted to be the Hayward and Rodgers Creek Faults.
As shown in Figure 11.2.2, most earthquakes in the vicinity of spreading ridges actually occur on the transform faults between ridge segments, rather than on the ridge itself.
Figure 11.2.4 shows a typical distribution of earthquakes associated with the subduction zone of a convergent boundary. Again, lots of earthquakes occur tens to even hundreds of kilometres from the actual plate boundary, but when a very large earthquake happens (like this 2009 example), the related shocks are mostly confined to the upper (cooler) part of the plate boundary.
As is shown in Figure 11.2.5, southern and central Asia have a vast region of occurring earthquakes where the India Plate is being forced into the Eurasia Plate. It is evident that the rock over a very wide area is being strained by this continent-continent convergence.
Working on the questions in Exercise 11.1 will help you to understand the earthquakes associated with subduction and transform boundaries in western Canada.
In Section 11.3 we look at some of the ways of measuring earthquakes. The magnitude of an earthquake is an expression of how much energy was released and is most often determined using seismic data. Be sure to review the material in the textbook on body waves and surface waves. Many methods are available to estimate magnitude—summarized in Table 11.1—but they are all attempts to find the same number, and each earthquake has only one actual magnitude.
In Exercise 11.2, you can play with a tool that enables you to estimate the moment magnitude of a number of different earthquakes using values for the length and width of the rupture surface and the amount of displacement. The last question asks you to use this tool to estimate the length, width, and displacement values for an M10 earthquake. This estimation will help you to understand why there is a limit to the size of earthquakes on Earth.
Exercise: Think about what necessary characteristics a planet would need for earthquakes to occur at a magnitude higher than 10.
As described in Section 11.3, an increase of 1 unit on the magnitude scale is equivalent to a 32-fold difference in the amount of energy released. Very large earthquakes (magnitude 8 or higher) release millions of times more energy than small ones (magnitude 2 or less).
Exercise: The December 2015 earthquake in the Saanich region of British Columbia had a magnitude of 4.7. The October 2012 earthquake off the coast of Haida Gwaii had a magnitude of 7.7. How many times more energy was released by the Haida Gwaii earthquake than the Saanich earthquake?
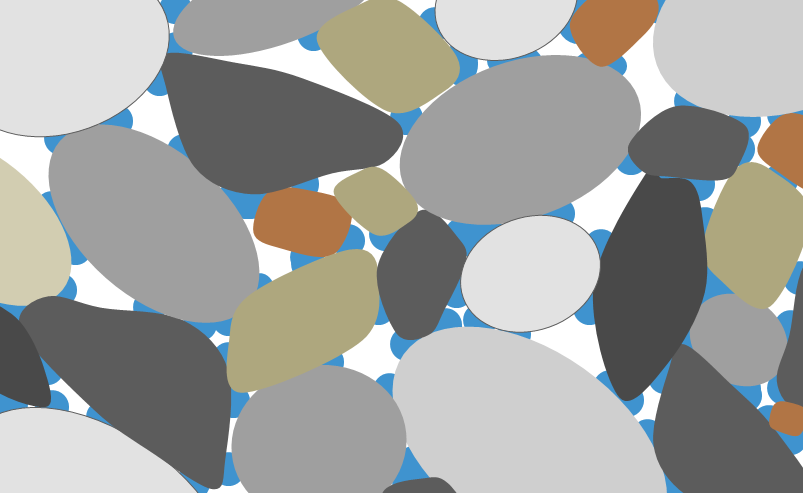
The other way of measuring earthquakes is to assess what people felt, and what type of damage was done. This is known as intensity, which is based on a descriptive scale (the modified Mercalli intensity scale in Table 11.4) that someone can use to assign a value based on their experience or their assessment of damage done to buildings. Unlike magnitude, intensity estimates for a single earthquake can vary widely, depending first on the distance of the observation site to the earthquake, and second on the type of geological material underlying the site. As noted in the textbook, shaking tends to be greatest in areas underlain by soft unconsolidated sediments, such as former lake sediments, fine-grained river sediments, or glacial sediments. These weak materials tend to have natural vibrational frequencies in the 2 to 3 second range (as compared to much less than 1 second for solid rock). This range of frequencies matches the frequency of the powerful body waves of earthquakes, which causes a resonant amplification of the shaking in the weak materials.
In Exercise 11.3, you can try your hand at assigning intensity values to actual observations made in 2001 in various parts of Nanaimo, BC, of an earthquake south of Seattle. You’ll find that the experiences of people were quite different, although they all were almost exactly the same distance (~250 km) from the quake. Think about why these differences occurred.
Creating intensity maps, like the one in Figure 11.3.4, is very useful because it provides us with some knowledge about which parts of a region are especially susceptible to earthquake shaking.
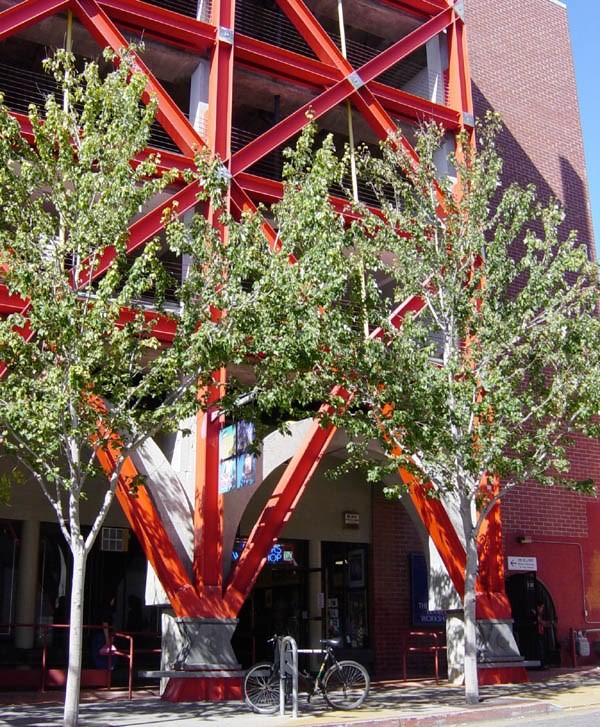
Some of the risks associated with large earthquakes are summarized in Section 11.4. Most earthquake damage is done to buildings, especially those with rigid rather than flexible frameworks. Wood-frame buildings, for example, tend to perform much better during seismic shaking than brick or concrete buildings. Another important principle of earthquake-resistant design is to construct buildings and other structures that don’t resonate in the 2 to 3 second range. This type of construction often can be achieved by using diagonal bracing as shown in Figure 3-8 on a building in Berkeley California close to the Hayward Fault.
As you read through Section 11.4, you’ll see that time and time again the greatest damage caused by earthquakes occurs in areas underlain by water-saturated soft sediments, where an amplification of the shaking and liquefaction of the material are both possible. In earthquake-prone regions, geological mapping to identify substrate characteristics is an important aspect of risk mitigation. Where no other options exist but to build on soft sediments—such as in the Fraser Delta area south of Vancouver—steps can be taken to compress and strengthen the material prior to construction, or to build on pilings that have been driven deep into the subsurface.
To get a better understanding of harmonic amplification and liquefaction, complete Exercise 11.4.
The other main risk from earthquakes is the generation of tsunami. Tsunami were primarily responsible for most of the 280,000 deaths in one of the Earth’s deadliest earthquakes—Sumatra, 2004—and for most of the tens of billions of dollars in damage in one of the Earth’s costliest earthquakes—Tohoku Japan, 2011. Tsunami are almost exclusively generated by large (M >8) subduction-related earthquakes, since these quakes typically involve vertical displacement of the sea floor by up to several metres over thousands of square kilometres.
It has long been a dream of seismologists and public safety officials to be able to accurately predict earthquakes so as to minimize damage and casualties. However, as summarized in Section 11.5, we are not close to that goal. Although some researchers have claimed limited success by detecting changes in some parameters prior to some earthquakes, there appears to be no precursor signal or observation that is consistently found prior to all earthquakes. To be successful, earthquake predictors need to be accurate most of the time, not just some of the time. People tend to quickly become very skeptical when presented with repeated false alarms. The biggest blow to earthquake prediction was delivered at Parkfield California in 2004, where hundreds of sensors and detectors of all imaginable types failed to record any prior signal of the M6 earthquake.
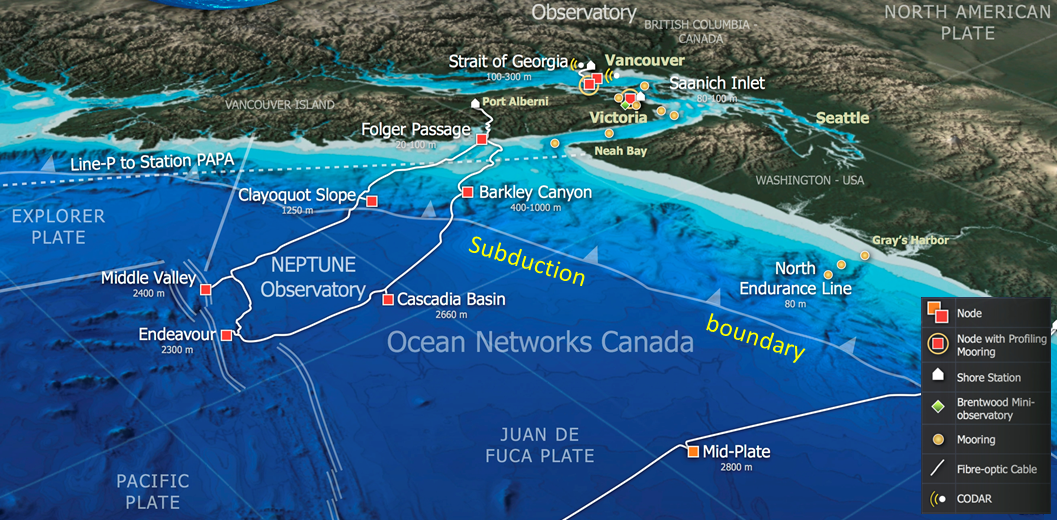
One important relatively recent advance is in the field of very fast automatic sensing and characterization of earthquakes based on their P wave signal. In areas with seismometer networks close to the expected locations of earthquakes, rapid detection can provide warnings that an earthquake has just happened (as distinct from a prediction that it is about to happen). Ocean Networks Canada, an initiative of the University of Victoria, has installed an ocean-floor observatory network up to 200 km offshore from the west coast of Vancouver Island (Figure 3-9). Included in this network are several seismometers that are capable of detecting earthquakes as they happen. If the P wave signals from an earthquake are processed automatically, the information about its magnitude and location can be sent to emergency officials and utilities within less than a second, which would provide warning times of 60 to 70 seconds for populated regions on eastern Vancouver Island (e.g., Nanaimo and Victoria) and over 80 seconds for the Metro Vancouver region, prior to the arrival of the first damaging S waves. That is plenty of time for utilities to shut down electrical circuits or close pipeline valves, and also would make it possible for many individuals to get to safer places.
Exercise: Try this out for yourself. Set a timer for 70 seconds and then see what you can do to ensure your own safety from an earthquake in that amount of time. It might mean moving to a safe place within a building, or getting outside and well away from buildings. Or it could mean not driving onto a bridge or quickly driving out of a tunnel. If you’re near to the shore, it also would give you time (at least 30 minutes) to get to higher ground, out of the way of a potential tsunami.
While we cannot predict earthquakes, we increasingly have good knowledge about areas that are at risk, and we can start to express that risk in terms of probabilities, as has been done in the San Francisco area by the US Geological Survey (Figure 3-7). If we know the risks in a certain area, we can start to prepare by creating and enforcing strong building codes, retrofitting important buildings such as schools, making public and personal emergency plans, and educating the public.
Please answer the review questions at the end of Chapter 11, and check your answers in Appendix 2 in the textbook.
This completes the notes for Unit 3.
Note if you are a registered student: If you haven’t already done so, now is the time to start working on Assignment 3 (go to the “Assignments Overview” area of the course). You should find most of what you need to complete the assignment within these unit notes and Chapters 9 to 11 of your textbook, but you might also need to refer to other sources of information.(Adapted from Ocean Networks Canada, 2013)